ficus: A (mixed integer) linear optimisation model for local energy systems
| Maintainer: | Dennis Atabay, <dennis.atabay@tum.de> |
|---|---|
| Organization: | Institute for Energy Economy and Application Technology, Technische Universität München |
| Version: | 0.1 |
| Date: | Jan 31, 2018 |
| Copyright: | This documentation is licensed under a Creative Commons Attribution 4.0 International license. |
Features
- ficus is a (mixed integer) linear programming model for multi-commodity energy systems.
- It finds the minimum cost energy system to satisfy given demand time-series for possibly multiple commodities (e.g. electricity, heat)
- It considers given cost time-series for external obtained commodities as well as peak demand charges with configurable timebase for each commodity
- It allows to deactivate specific equations, so the model becomes a linear programming model without integer variables
- It supports multiple-input and multiple-output energy conversion technologies with load dependent efficiencies
- ficus includes reporting and plotting functions
Installation
If you don’t already have an existing Python I recommend using the Python distribution Anaconda. It contains all needed packages except Pyomo.
- Anaconda (Python 2.7 or Python 3.5). Choose the 64-bit installer if possible. During the installation procedure, keep both checkboxes “modify PATH” and “register Python” selected!
- Pyomo (pip install pyomo)
- download or clone (with git) this repository to a directory of your choice.
- Copy the
ficus.pyfile to a directory which is already in python’s search path or add thepythonfolder to python’s search path (sys.path) (how to) - Install a solver (optional).
Get started
Solver
Pyomo allows using the NEOS Server for Optimization for solving, so it is not required to install a solver.
I still recommend to install and use one of the following solvers.
CPLEX (commercial)
Download and install IBM’s CPLEX solver. (Free for academics)
Gurobi (commercial)
Download and install Gurobi solver. (Free for academics)
Screenshots
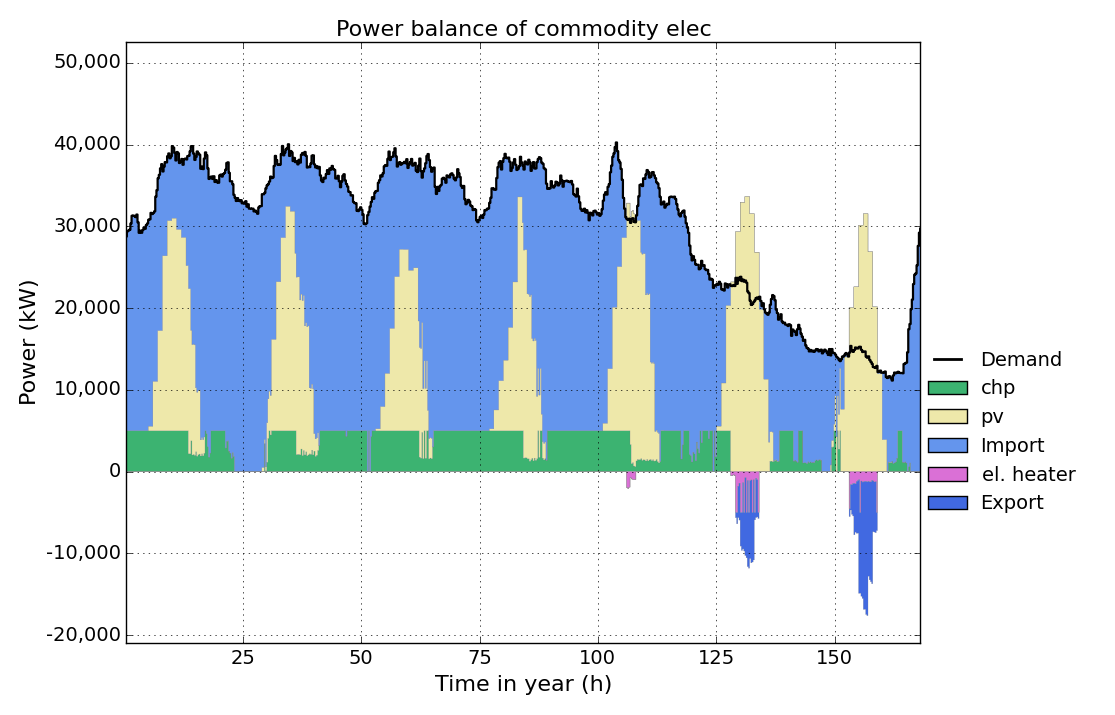
This is a typical result plot created by ficus.plot_timeseries(), showing electricity
generation and consumption over 7 days: